HAPS
05 Web-HUMAN Workshop
Introducing Web-HUMAN
version 6 with
more powerful graphing capabilities and the option to save/retrieve simulations
Note: The document below introduces 6 variable graphing & experiment save/retrieve in workshop (screen by screen) format. It was written for Human 6 which differs from Human 6.1 only in the lack of within-the-model on-line help. A refresher page summarizing the differences between 6.0 & 6.1 screen formats is available here.
I. Registration / login
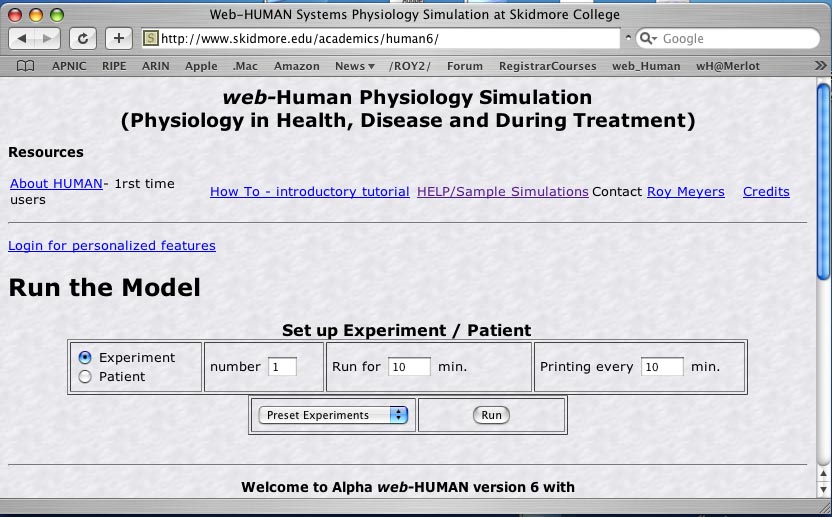
1) Access web-HUMAN 6 by directing your browser to the address immediately below:
2) Register by clicking on the link "Login
for personalized features" (see above, left).
Login allows users to save and retrieve their experiments. It is not required
for use of any other feature of web-HUMAN.
3) You will be presented with the Login screen (see directly below).
First time users should click on Register
here .... (below, top, right).
After this one-time registration simply fill in the left hand side's edit fields
and click <Login>

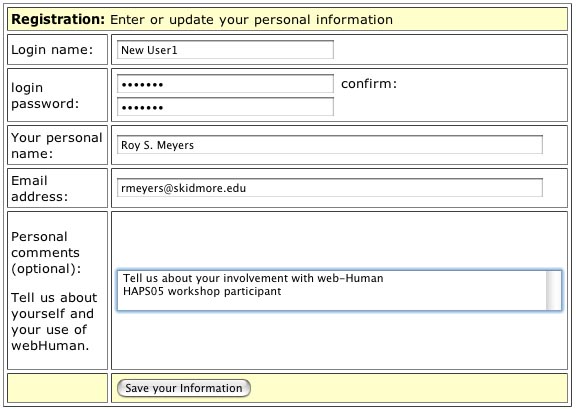
4) Enter your Registration information in
the form (see below; I have used myself as an example).
Then click on <Save your information>
(see below, bottom of the form).
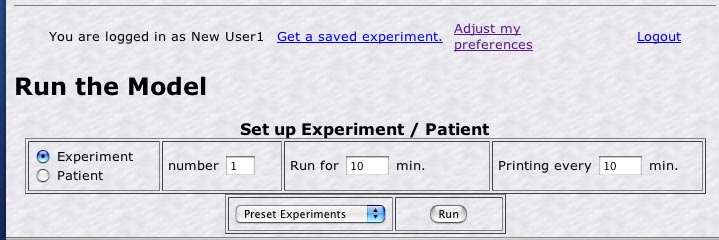
5) Next click on <Resume>
and you are returned to the main screen (see below).
If you don't see the "You
are logged in as ...> message (top left below) hit the refresh screen
button in your browser.
II. Running and saving a sample experiment
1) Accept the default settings above (Experiment,
number 1, Run for 10 min. and Printing every 10 min.) by simply clicking
on the <Run>
button (see above). You will next see the screen below.
Normally in a workshop we begin by getting folks used to how to run web-HUMAN
itself. Today to save time we will only briefly explain the main HUMAN screen.
Check the Help documentation for very clear step-by-step tutorials if you wish
to learn more about the mechanics of how to run the model itself.
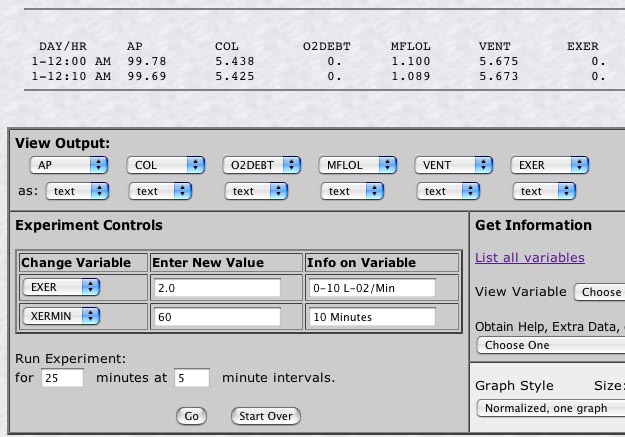
2) You will be setting up to run a simple exercise experiment. Examine the screen above.
View Output:
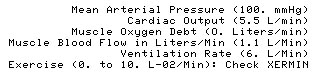
(top)- You have by default accepted that the model will print out a table of
six variables, reading left to right,
AP, COL, O2DEBT, MFLOL,VENT, EXER and defined as below: (much
more detail on HUMAN variables can be obtained by clicking on the link List
all variables (under Get Information)
Experiment
Controls (middle, left)- Under Change
Variable mouse the first box menu to EXER
and type in 2.0.
This will cause the model to exercise at a level of 2.0 Liters/Min.of O2 consumption
above its basal level.
Mouse the second box menu under Change
Variable to XERMIN
and type in 60.
This will cause the model to exercise at the level set by you for 60 minutes
before ceasing to exercise.
Run Experiment: type in
for 25 and 5 minute intervals.
This will cause the model to exercise at the intensity you have set (2.0) for
25 minutes with 5 minutes between readouts.
Click on <Go> to cause HUMAN to run your simulation as set up by you.
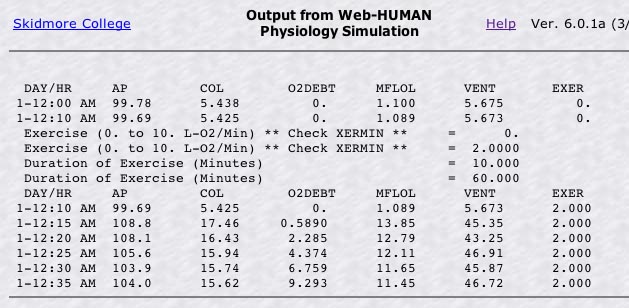
3) Output from Web-HUMAN - You see the default tabular output
screen shown below.
We will briefly eyeball and discuss the gestalt of the response pattern of the
six variables during the 25 minute (12:10-12:35) exercise session (left to right)
Arterial Pressure, Cardiac Output in Liters, O2 Debt, Muscle FLOw in Liters
and lung VENTilation.
III. Plotting the exercise data
1) Hit the <Back>
button on your web browser - this returns you to the point before
you ran the experiment and leaves you ready to click <Go> again. Note
that you are already set up for the exercise session.
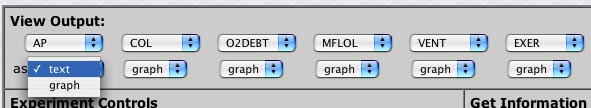
2) To graph any variable, simply mouse it under View
Output: (see AP below) from text to graph.
3) Set all six variables from text
to graph as was done below.
4) Pick your graphing options (see Graph Style below and the lower right of your screen).
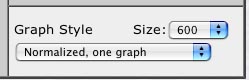
For now we will accept the defaults of one graph (vs. individual ones) and normalized (vs. absolute value).
5) Generate your graph - Having picked which variables to
graph and selected your graph style again click on <Go>.
In addition to the tabular output you will now see the graph below (providing
that pop-up blocking is disabled).
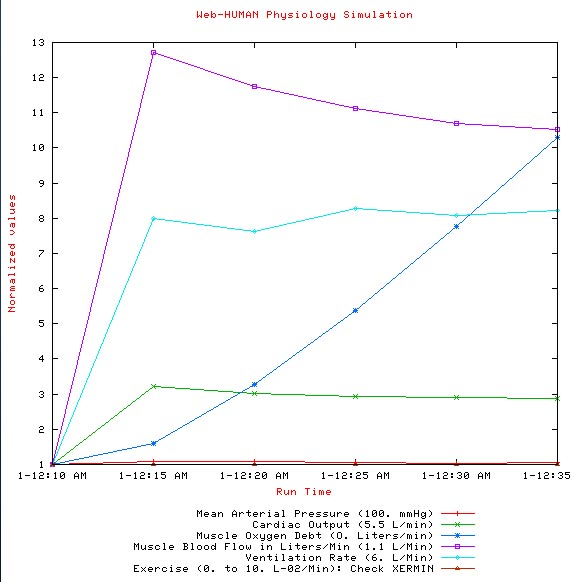
6) Examine the plot.
Normalized plots show the change from the baseline value of a variable.
a) Compare the cardiac output and muscle flow changes. Which is greater? What does this imply for vascular resistance?
b) Compare the ventilatory and circulatory flow changes. Which is greater? What does this imply for O2 delivery from the environment to the working muscles?
IV. Saving an experiment
Let's imagine that we wish to have our students consider exactly the issues
outlined above. That can be done by Saving this experiment along with these
questions as outlined below.
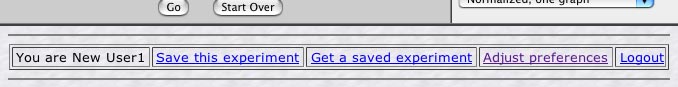
1) Examine the bottom of your screen. You will see the options shown below.
One of these is "Save
this experiment". Click on it.
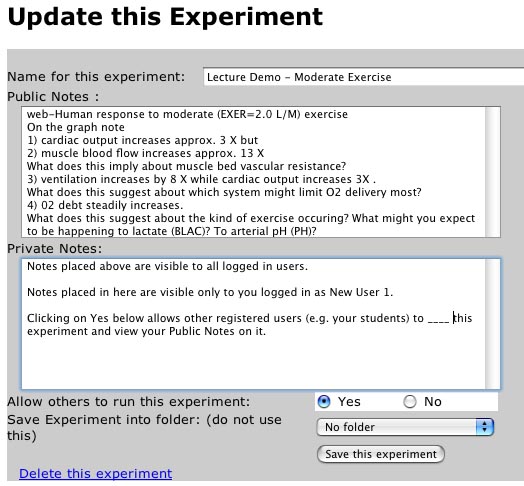
2) You now see the Save
this Experiment screen as below.
Fill it out as shown for practice. Notice the following
elements
Top - the name that users will see for this experiment.
Public Notes: here is where I stored for my students the questions
we just considered in the workshop.
Private Notes: Read the box. It is self-explanatory.
Share the experiment with others: Make certain that Yes
remains selected.
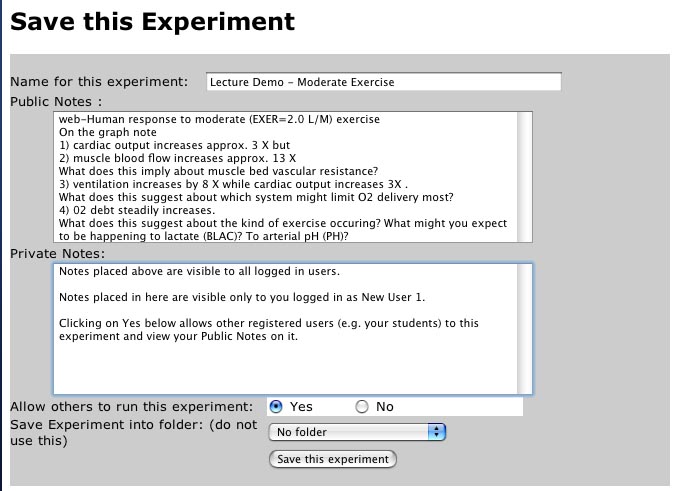
When satisfied with what you have, click <Save this experiment>. Note that you can edit anything you save later if you wish to make changes, correct errors, etc..
After your Save, click on <Back> (see below) to return to your current session.

V. Retrieving a saved experiment.
1) You (or your students) can call back this or any other shared experiment.
To do so click on Get
a saved experiment (see below)
![]()
2) This brings you to the Retrieve
a Saved Experiment Page.
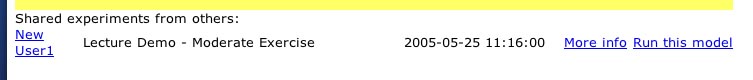
This page has two sub-sections, one for your experiments and one for those of
others i.e. Shared
experiments from others: see below.
You will find your recently saved experiment in your saved experiments section.
Let us examine your Lecture Demo you just saved (see below)
Click on More
info.
3) You will see something like the screen below. This is what other users, for example your students, will see. Only you see the Private Notes, of course.
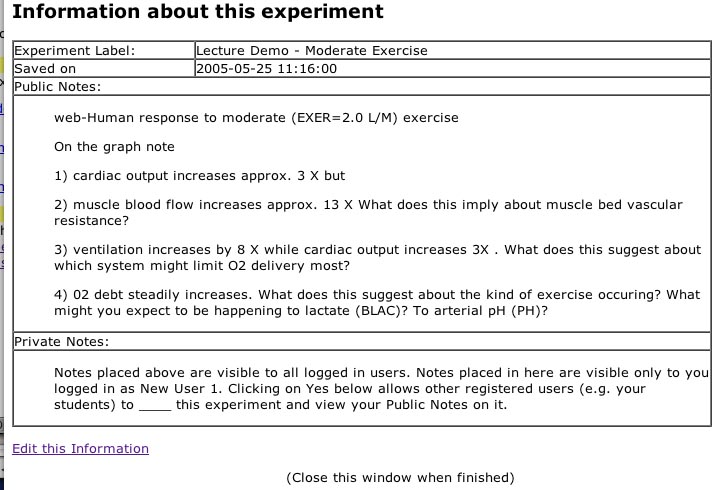
4) Notice that you can update/edit your write-up.
Click on Edit
this Information (lower left, above). Your will see the screen below.
Make some minor change and select Save this experiment to effect it.
Notice that you could Delete
this experiment if you so wished (but don't!).
Hit <Back>
and then Close this
Window as asked.
VI. Running a saved experiment.
If you closed the window you should now see your original screen of choices as below.
Last time you used the More
info option.
This time click on Run this
model.
Bang! The entire model you saved runs in a flash!
It is ready for your use. Some possible uses include lecture demonstration,
student simulation assignments and creation of new patients that do not exist
in the standard web-HUMAN Patients category. Each of these is explored briefly
in the next section of the workshop.