I. Introduction
One of the concepts that physiology students perennially have difficulty with is the difference between blood oxygen partial pressure (PO2A) and content (O2A) (and between dissociation curves plotted as % saturation and as content). An anemia simulation nicely provides a different sort of venue in which to examine these concepts. In addition, because anemia potentially induces tissue hypoxia it also provides a vehicle through which to examine the vasodilatory effects of hypoxia on the cardiovascular system.
In this simulation we induce a progressive anemia by interfering with the production of red blood cells (erythropoiesis) while allowing them to continue to be destroyed at their normal rate. This results in a progressive drop in the hematocrit (HCT, the % of blood that is red cells).
II. Anemia induction
**Note: Always look up each newly introduced variable in Help> Help Info on: to familiarize yourself thoroughly with the variable before working with it.
An anemia can be created in web-HUMAN by reducing basic erythropoiesis (red cell production) to zero (ERYTHB = 0.0)**. Such an anemia (due to decreased hematocrit HCT**) mimics the decreased red cell mass (RCM**) & hemoglobin (HGB**) that can accompany several disease states including malnutrition and renal disease. This is a slowly developing anemia in which HCT drops progressively from values near 45% to around 10% over a 70 day period.
Such an anemia has various physiological consequences of which we will confine ourselves here primarily to two, the drop in blood O2 content (O2A**, O2V**) and the hemodynamic consequences of the compromise of O2 delivery to the tissues (vasodilation).
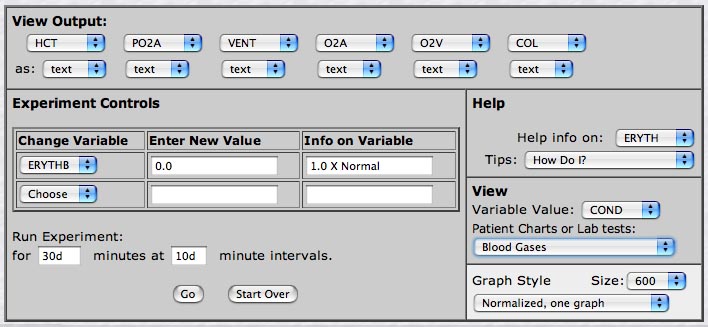
III.
Setting up the anemia simulation
Since we are
now all somewhat seasoned web-HUMAN veterans we will set the basic
experiment up in a single step. The screen below shows the setup,
the logic of which is described below the figure.
Table Columns (left, top) - View Output: tables are set to read out hematocrit (HCT), arterial O2 partial pressure (PO2A**), total lung ventilation (VENT), arterial and venous O2 content (O2A and O2V) and cardiac output in liters/min. (COL). Note the O2 extracted by the tissues in the difference between the arterial and venous contents (O2A - O2V) and is normally 0.19 - 0.15 ml O2/ml blood (0.04) at rest.
Change Variable(left, middle) - Set erythropoiesis to zero (ERYTHB = 0.0)
Run Experiment - We will initially run for 30 days (30D) with 10 days (10D) between printouts.
We will later extend the experiment out 70 days.
View Variable Value: (right, middle) - Set to the vascular conductance (ease of blood flow, COND**), an indicator of the degree of vasodilation.
Patient Charts or Lab tests: (also in View section, right) - Set to Blood Gases*. This conveniently provides O2 partial pressures and content for arterial and venous blood. *Mouse help> Tips: Blood Gas Sample to familiarize yourself with the procedure before working with it.
Ready to roll! - click <Go>.
IV. Examine the data pattern - Day 30
We first 'eyeball' these questions at 30 days. After 60 days (next run) you will find a section in which you can fill in your observations.
* values for additional variables can obtained by picking each, one at a time, under View Variable Value: <Choose> and Clicking <Go>. The new value is simply added to the bottom of your current experimental run.
V. Continuing the simulation
In order to obtain a data set at still lower HCTs execute each of the following two steps
A] Run for another 30 days - set up exactly as you did for the first 30 days. Click <Go>.
B] Run for another 9 days - set up exactly as you did for the first 30 days but Run for 9D with 2D intervals.
Reconfirm the trends noted after the first 30 days. Here is the same checklist. After the "another 30 days" (so total = 60 days) you will find a section in which you can fill in your observations to these questions almost directly below.
VI. Get an autopsy report - Under View: Patient Charts or Lab tests: to "Your Patient's Chart."
Why has the subject perished? You also get to address this question almost directly below.
VIIa. Using data from the 60 day point, try these questions: (for Medical Physiology students only)
How far has the hematocrit dropped? How much are hemoglobin content and red cell mass compromised?
How much effect has this drop had on 1) the arterial PO2 2) the arterial O2 content?
Examine the ventilation response. Why has it not risen in response to the O2 content hypoxia?
Quantify what has happened to O2 extraction by the tissues (O2A-O2V).
Follow the cardiac output response. What has happened & why?
Why does the model expire?
What has happened to blood viscosity ? What role might this play in the increase in COL? COND? (simply use your Browser's Back arrow to go back in time & place viscosity in your Tables)
Blood volume has dropped at day 31. Why? (simply use your Browser's Back arrow to go back in time & place blood volume in your Tables. Recall our analysis of factors determining fluid balance in the lungs and tissues.)
VIIb. Some explanatory notes - these can be found as a supplementary document.
If you find this lab helpful or have suggestions/questions, drop us a line . As always our entire intention in making web-HUMAN available is to provide the teaching community with a high quality, easily available, free resource. Just email me at rmeyers@skidmore.edu.