Web-HUMAN
Sample Experiment
Emphysema Simulation
(a sample clinical simulation)
(updated August 18, 2011)
Simulation of a clinical condition involves changing the values of key physiological variables so that the simulation 'behaves' like the clinical condition. HUMAN has many built in tools directly designed for this purpose (e.g. see CLAMP, a renal artery clamp to induce Goldblatt hypertension or CAD to induce coronary artery disease).
This particular example simulates aspects of emphysema by reducing the mean surface area (MSA) available for gas diffusion in the lungs.
1) To begin
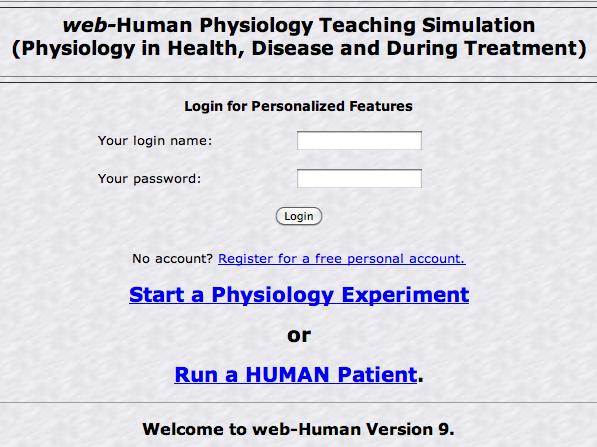
To set up HUMAN, prior to inducing the disease state (i.e. control), at the opening screen (see below)
Click
• Start a Physiology Experiment (see above, middle).
* always remember that if you wish to Save your experiment you must log in first (above, top)
This results in the typical opening "Output from Web-Human" experiment screen seen below.
2) To set up your experimentHUMAN is now ready to be set up with a reduced mean lung surface area for a 30 plus day experiment while tracking various respiratory and cardiovascular variables in its tables. The steps involved in this setup are shown in the experiment navigator picture below and then described sequentially in the text that follows.
To reduce mean lung surface area
• roll down under the Change Variable column in the Experiment Controls section to MSA and reset it from its default value (100%) to a new value of 20.
• This reduces lung surface area available for gas diffusion by a full 80%. (a more realistic long term slow, progressive loss of lung surface could also be simulated if desired).
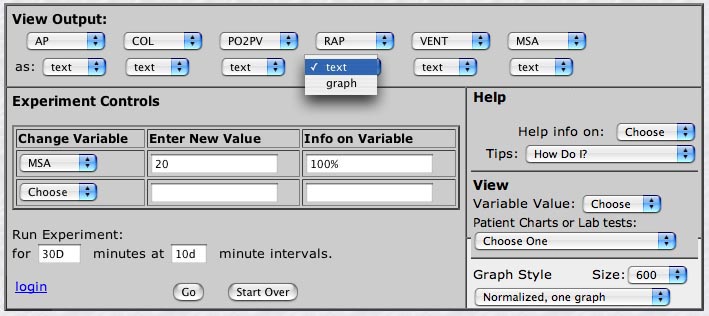
To select more useful tables for viewing variables relevant to the results in this experiment
• Under the View Output: section (top), mouse click and the roll down each of the six available output variables to select of the new variables indicated above in columns 1-6.
• These are (left to right) arterial pressure(AP), cardiac output(COL), pulmonary vein PO2(PO2PV), right atrial pressure(RAP), lung ventilation(VENT) and lung/capillary mean surface area(MSA).
To insure tabular output (i.e. no graphing in this case)
• simply leave the as: choice (line 2, top) in its default text position (see RAP above).
To select an appropriate time span in which to view the developing situation
under "Run Experiment:" pick a 30 day (30D or 30d) period with data views at 10 day (10D) intervals.To begin the simulation click on <Go>.
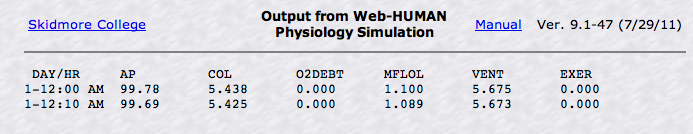
3) The output of your experimentResults of the first 30 days are shown directly below.
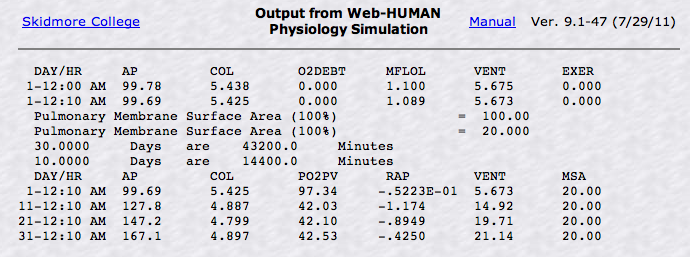
Notice (see above)
• the sharp drop in pulmonary vein PO2 (PO2PV).
• the sharp (and unsuccessful) compensatory rise in ventilation (VENT) induced by the peripheral chemoreceptors and the hypoxic hypertension.
4) Experiment output - other viewing options
Individual other variables (not in your tables) could be viewed at this point in time
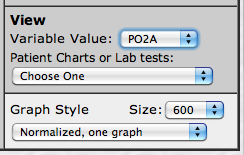
• Under the View section (see left, below), use the "Variable Value <Choose>" option.
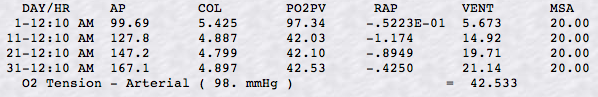
Simply mouse the Variable value of your choice, here arterial PO2, and then click <Go>.• This results in an output (see right, below) in which the last line gives you the current value (at day 31) of the blood arterial O2 tension.
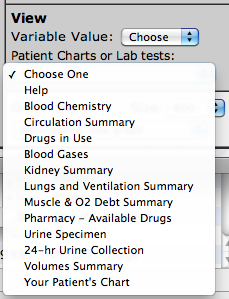
Entire system profiles (cardiovascular, renal, respiratory, etc.) can be viewed with the "Patient Charts .. " option under the same View section (see above left & below).
Again simply select your Chart choice and press <Go).]
5) Continuing the experiment
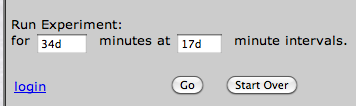
To continue the experiment out to Day 65, in Run Experiment: we enter values as below
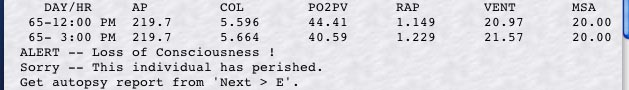
The results of continuing the simulation out to 65 plus days are shown below:
a) Notice (above) that at Day 65 -slightly past 12:00 P.M.- most key values have markedly worsened (PO2PV is down to 44 mmHg, AP has risen to 219 mmHg).
b) Also note that at (Day) 65-3:00 PM the model gives a message of
"ALERT -- Loss of Consciousness !"
followed by
"This individual has perished."
and that the user is prompted to
"Get (an) autopsy report".
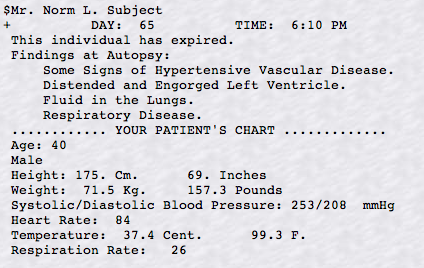
The autopsy report can be obtained by rolling down the "Patient Charts or Lab tests: " option and asking for "Your Patient's Chart" (see below) and then pressing <Go>.
The autopsy results due to this request appear below.
To summarize
- Clinical situations can be simulated by selecting the appropriate variables and forcing the physiology in the desired pathologic direction.
- Finding HUMAN's pathology induction variables
1) In Help, using Tips: <How Do I> --> Induce Pathology will reveal a wealth of built-in mechanisms to induce various physiologic pathologies.
2) In Help, variables inducing pathology can also be sought out by clicking on Help info on: <Choose>
and then clicking on the View summary of all variables option, This allows one to search all variables.3) Advice on how to make use of these variables is detailed both via the links on these screens and in the Annotated List of Variables & Parameters in the Manual.
An additional example of the induction of pathology can be found in the User's Manual section "Using the more advanced features of web-HUMAN" sub-section/ Create Physiological Pathology where a pheochromocytoma patient is created and stored for future use.