web-HUMAN
A Sample Use of the Save/Retrieve Capability
A Student Designed Experiment
Note: Caveat emptor! The document below introduces student use of the save/retrieve capability in workshop (screen by screen) format. It was written for the HAPS 2005 Workshop (Human 6) and therefore displays screens that have since changed somewhat in their appearance.
Note 2: The material below assumes the user has been through the basic web-HUMAN tutorial, is familiar with save/retrieve procedures and is logged in. Step by step tutorials for each set of skills can be found on the main Help page.
Web-HUMAN, with its save/retrieve experiment features, presents physiology educators with expanded pedagogical capabilities. One such possibility is to have students, in response to an instructor's assignment, create and save their own models for later evaluation by the instructor. The example below is drawn from one such exercise in a 4 lab / fifty student Comparative Vertebrate Physiology course at Skidmore College in Spring, 2005.
The lab assignment was to 1) create a simulated fever in web-HUMAN by raising the hypothalamic set point (TEMSET) from 37 degrees C to 39 degrees C and 2) to track body temperature response and the responses of the various routes of heat gain and loss.
The course also stresses scientific writing skills and as such students were asked to ...... "
1) Consider your audience to be a person (perhaps a fellow student or instructor) in El Paso or Vancouver.
2) Your Title
Can users look at it & clearly get a feeling for what this model is about? In a way this is no different than the titles of your course lab write-ups. How accurate & clear an overview does it provide the reader?
3) Your explanatory text
Does it communicate in concise fashion the essence of what was done experimentally (design) and what the major result(s) is?"
We will now examine the student responses to this assignment.
1) Accessing the student responses
They are saved in web-HUMAN and the method of access is via Save/Retrieve as outlined on the main Help
page.
To access them [recall- This was written for the HAPS 2005 Workshop (Human 6) and therefore displays screens that have since changed somewhat in their appearance.]
A] Start the model afresh <Start
Over>.
B] If you are not already logged in click on Login
for personalized features (see below)
C] Login (see below; if not registered do so now)

D] After logging in click on the <Resume ... > button if necessary (see below)
![]()
E] If you do not see the You are logged .... message below hit the refresh button in your web browser

F] Locate the folder Student
expts Bio 236_Sp05 (see below) via the following steps (this path works - updated Dec. 2011)
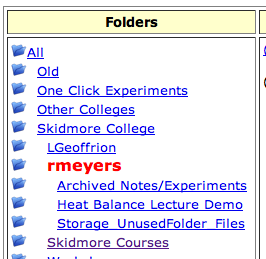
Find folder rmeyers in folder Skidmore College |
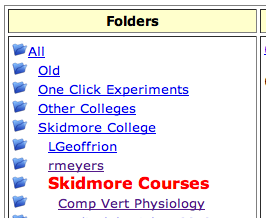
Find folder Comp Vert Physiology in folder Skidmore Courses |
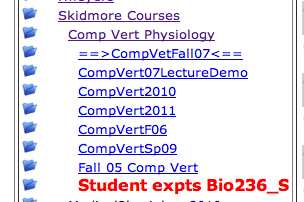
Find Student
expts Bio 236_Sp05 in folder Comp Vert Physiology |
 |
 |
 |
G] You are now looking at a list of the models created by some 43 students. Scroll toward the middle (Lab section 002) and locate the entry shown below by student l_bloome
![]()
We are examining this entry because it exemplifies a reasonable try at an informative title. I would perhaps add 39 °C. It tells the reader that this is a (39°C) fever (simulation) and that the thermal processes of sweating (heat loss) and shivering (heat gain) and metabolism are monitored in the data.
II. Examining a stored student model
a] Examine the title - see above
b] Examine the data table and plot
Scroll a bit further down until you locate the model below by e_brown.
1] Run the model by clicking on the Run link. This calls back and runs the student's simulation.
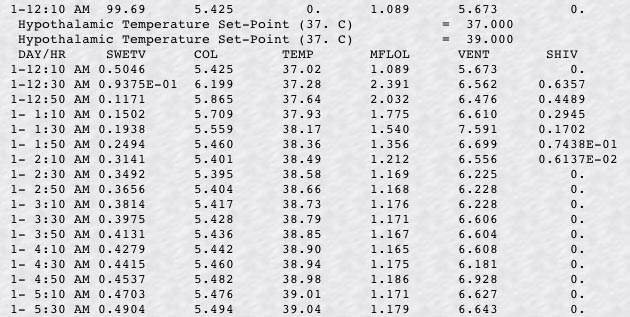
A graph and table appears. Click on the table to bring it to the foreground. Examine it.
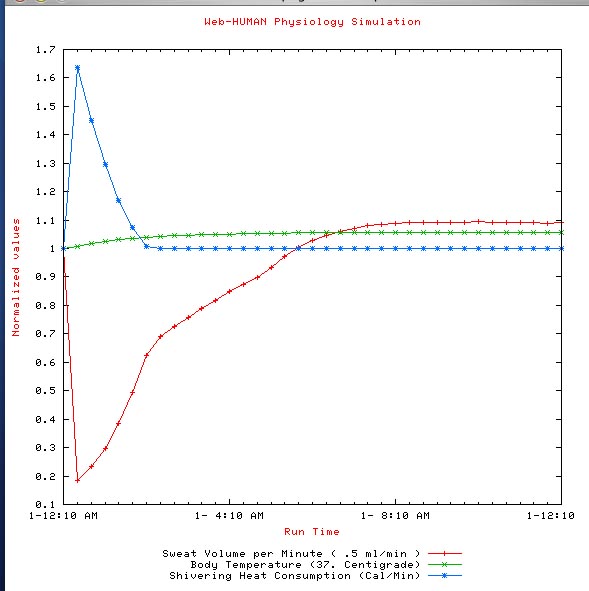
The relevant variables chosen to be monitored by this student are sweat volume (SWETV), body temperature (TEMP, degrees C) and shivering (SHIV). Eyeballing these on the table we see body temperature rise towards and finally slightly overshoot the 39 degree target, sweat volume to first decrease and then finally begin to rise again and shivering to first rise steeply and then be turned off.
2] This pattern is summarized well in the student's plotting choices (see below)
Close the plot and hit the <back button in your browser to return to the main screen as below.
![]()
c] Examine the write-up
Click on Info to see the student's write-up as seen immediately below. Read through it and decide for yourself how well it accomplishes the purpose of explaining the behavior of the model.
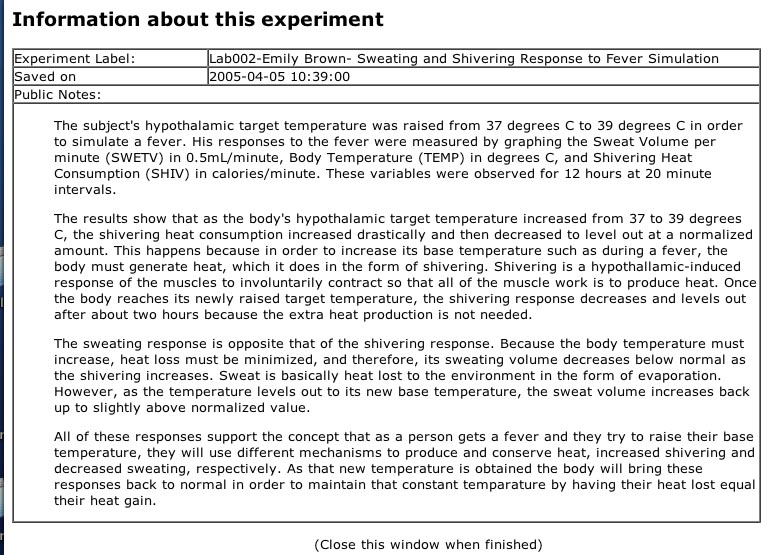
Close the window when finished.
Feel free to examine any of the other student contributions. They range from some that are superior to these examples on down through some fairly less well focused experimental designs and write-ups.
.