I. Introduction
One of the concepts that physiology students perennially have difficulty with is the difference between blood oxygen partial pressure (PO2A) and content (O2A) (and between dissociation curves plotted as % saturation and as content). An anemia simulation nicely provides a different sort of venue in which to examine these concepts. In addition, because anemia potentially induces tissue hypoxia it also provides a vehicle through which to examine the vasodilatory effects of hypoxia on the cardiovascular system.
In this section we induce a progressive anemia by interfering with the production of red blood cells (erythropoiesis) while allowing them to continue to be destroyed at their normal rate. This results in a progressive drop in the hematocrit (HCT, the % of blood that is red cells).
II. Anemia induction
An anemia can be created in web-HUMAN by reducing basic erythropoiesis (red cell production) to zero (ERYTHB = 0.0). Such an anemia due to decreased hematocrit mimics the decreased red cell mass (RCM)& hemoglobin (HGB) that can accompany several disease states including malnutrition and renal disease. This is a slowly developing anemia in which HCT drops progressively from values near 45% to around 10% over a 70 day period.
Such an anemia has various physiological consequences of which we will confine ourselves here to two, the drop in blood O2 content and, if time allows, the hemodynamic consequences of the compromise of O2 delivery to the tissues (vasodilation).
III.
Setting up the anemia simulation
Since we are
now all seasoned web-HUMAN veterans we will set the basic
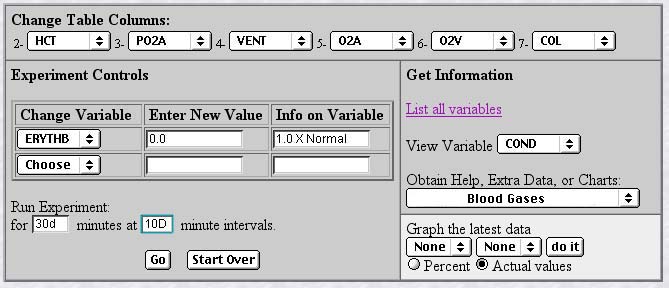
experiment up in a single step. The screen below shows the setup,
the logic of which is described below the figure.
Table Columns (left, top) - Tables are set to read out hematocrit (HCT), arterial O2 partial pressure (PO2A), total lung ventilation (VENT), arterial and venous O2 content (O2A and O2V) and cardiac output in liters/min. (COL). Note the O2 extracted by the tissues in the difference between the arterial and venous contents (O2A - O2V) and is normally 0.19 - 0.15 ml O2/ml blood (0.04).
Change Variable(left, middle) - Set erythropoiesis to zero (ERYTHB = 0.0)
Run Experiment - We will initially run for 30 days (30D) with 10 days (10D) between printouts.
We will later extend the experiment out 70 days.
View Variable (right, middle) - Set to the vascular conductance (ease of blood flow, COND), an indicator of the degree of vasodilation.
Obtain Help, Extra Data, or Charts(right) - Set to Blood Gases. This conveniently provides O2 partial pressures and content for arterial and venous blood.
Ready to roll! - click <Go>.
IV. Examine the data pattern
V. Continuing the simulation
In order to obtain a data set at still lower HCTs execute each of the following two steps
A] Run for another 30 days - set up exactly as you did for the first 30 days. Click <Go>.
B] Run for another 9 days - set up exactly as you did for the first 30 days but Run for 9D with 2D intervals.
Reconfirm the trends noted after the first 30 days. Here is the same checklist.
VI. Get an autopsy report - Set Obtain Help, Extra Data, or Charts to "Your Patient's Chart."
Why has the subject perished?
VII. Some explanatory notes
How far has the hematocrit dropped?
HCT drops progressively because red cell production is zero and red cell destruction continues at a constant rate. This results in a progressive decrease in red cell mass and blood hemoglobin content and therefore progressively lowers O2 carrying capacity.
How much effect has this drop had on 1) the PO2 2) the O2 content?
While there is less hemoglobin available all of it that is still present gets well-oxygenated. Therefore PO2 (mmHg) does not drop. O2 content (i.e. how much O2 is carried per ml of blood), on the other hand, does drop simply because there is less hemoglobin present to bind it.
Examine the ventilation response. Why has it not risen in response to the O2 content hypoxia?
While there is a developing tissue hypoxia due to the low arterial O2 content the respiratory O2 chemoreceptors sense PO2, not content, and thus are perfectly happy.” They thus do not increase ventilation.
Estimate what has happened to O2 extraction by the tissues (O2A-O2V).
[O2A - O2V] narrows progressively from its original 0.04 ml/ml value because arterial content (O2A) drops progressively but the tissues continue to consume O2 at a near normal rate.
Note the response of cardiac output.
It rises dramatically and progressively. Tissue hypoxia causes peripheral vasodilation (note the rise in vascular ease of flow - COND). Since (CO = COND * AP) cardiac output depends on both driving force (arterial pressure - AP - remains constant) and ease of flow (COND - rises) cardiac output progressively rises. This is in a sense adaptive as it delivers more blocks of O2 poor blood to the tissues.
Why does the model expire?
The model dies of high output heart failure (note left & right hypertrophy, systemic edema in the autopsy). The heart can not meet the increasing demands on it for still higher flows.
Note that there are other major aspects here not discussed including issues of the role of the HCT drop in increasing flow (check out viscosity - VISC) and fluid shifts [check out fluid loss (PV) due to protein (HGB) and other osmotic particle (RCM) loss ].
As always, for those interested I would be glad to provide a more complete analysis. Our entire intention in making web-HUMAN available is to provide the teaching community with a high quality, easily available, free resource. Just email me at rmeyers@skidmore.edu.