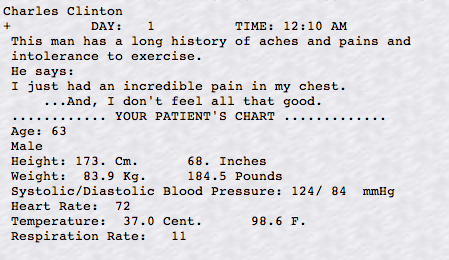
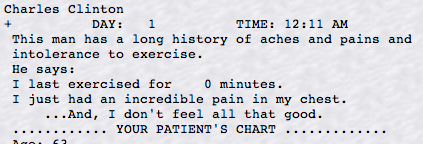
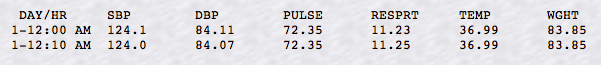
Upon calling up Mr. Clinton we are presented with vital signs data all of which appears to be within normal range.
We also note that we are provided with the preliminary hints of a history exercise intolerance along with the chronic aches & pains.
Case - Aches & pains; exercise intolerance
Hints page
I. The Case (& preliminary "hints")
Case - History of aches & pains; exercise intolerance
II. The Initial Output data
Upon calling up Mr. Clinton we are presented with vital signs data all of which appears to be within normal range.
We also note that we are provided with the preliminary hints of a history exercise intolerance along with the chronic aches & pains.
III. To obtain the Patient's Chart
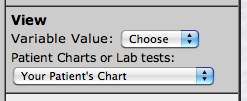
We first ask for Mr. Clinton's Chart by selecting for it under the View option, running for 0 minutes with 0 minutes between printouts to obtain the information at this moment.
This results (see below) in a Chart data set that informs us
of both an intolerance to exercise (line 2) AND that Mr. Clinton just experienced severe chest pains.
IV. To test the exercise intolerance
We can both 1) run the standard HUMAN exercise tolerance test (see the bottom of the main patient selection page for the protocol) AND simultaneously 2) obtain Mr. Clinton's Chart with report of all symptoms and his time to cessation of exercise by calling up a fresh copy of Mr. Clinton at time zero and testing him at that point in time..
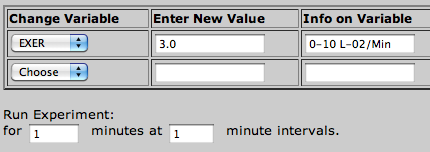
In deference to his reported chest pains, we begin Mr Clinton at zero time again and also reduce the demands of the exercise test from its usual 11 minutes duration (the expected normal at this level of exercise intensity). The steps to do so follow below,
A] To also set up some Output tables viewing useful cardiovascular variables we reset out View Output: as below.
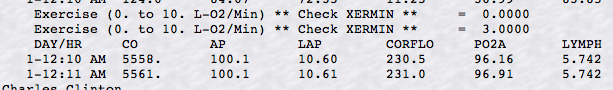
These are, left to right, Cardiac Output (CO), mean systemic arterial pressure, left atrial pressure as a measure of preload, coronary blood flow, arterial O2 PO2 and LYMPH flow as a possible measure of edema tendency.
B] In deference to the "chest pain" reports, we ask for much less (1 minute!) than the standard 11 minutes of exercise tolerance duration (below)
C] As per the standard HUMAN exercise tolerance protocol we also ask for < Your patient's chart > under the <Patient Charts or Lab tests: > section.
IV. Results of the exercise tolerance test
The output of the cardiovascular variable tables themselves are somewhat revealing, particularly the elevated left atrial filling pressure (LAP).
Mr. Clinton's chart (below) at the cessation of the exercise tolerance test is particularly striking.
We particularly note that his exercise tolerance time-to-cessation (due to a > 10L accumulated) O2 debt is ZERO minutes (as opposed to the standard of 11 minutes).
In addition we note the reoccurrence of the chest pains on exercise.
V. More
This ends the hints section on this case.
You should attempt again at this point to arrive at a diagnosis and, where possible, a treatment. To do so
• Return to the HUMAN model's Physiology Lab section for this patient and verify
- the diagnosis by finding the appropriate variables to support your argument and
- the treatment by changing parameters so as to stabilize the patient.
VI. Analysis
If you wish further analysis and a diagnosis on this case and information on how it was created, click on this link ( analysis ) and log in as requested.
* Note: Case hints and analyses are based heavily on Drs. Randall and Coleman's HUMAN-80 Instructor's Manual supplemented by notes of Dr. Coleman's in the model code itself and findings by myself and other colleagues over our years of use of these cases.